


Analytics & reports
Ask the quality system a question once. Each reader gets the answer they may see.
A metric stores the question, not the number. Every tile, report and alert works it out again for the person reading it, under their own access, so a dashboard can be shared with the whole company without sharing the records behind it.
What a figure carries
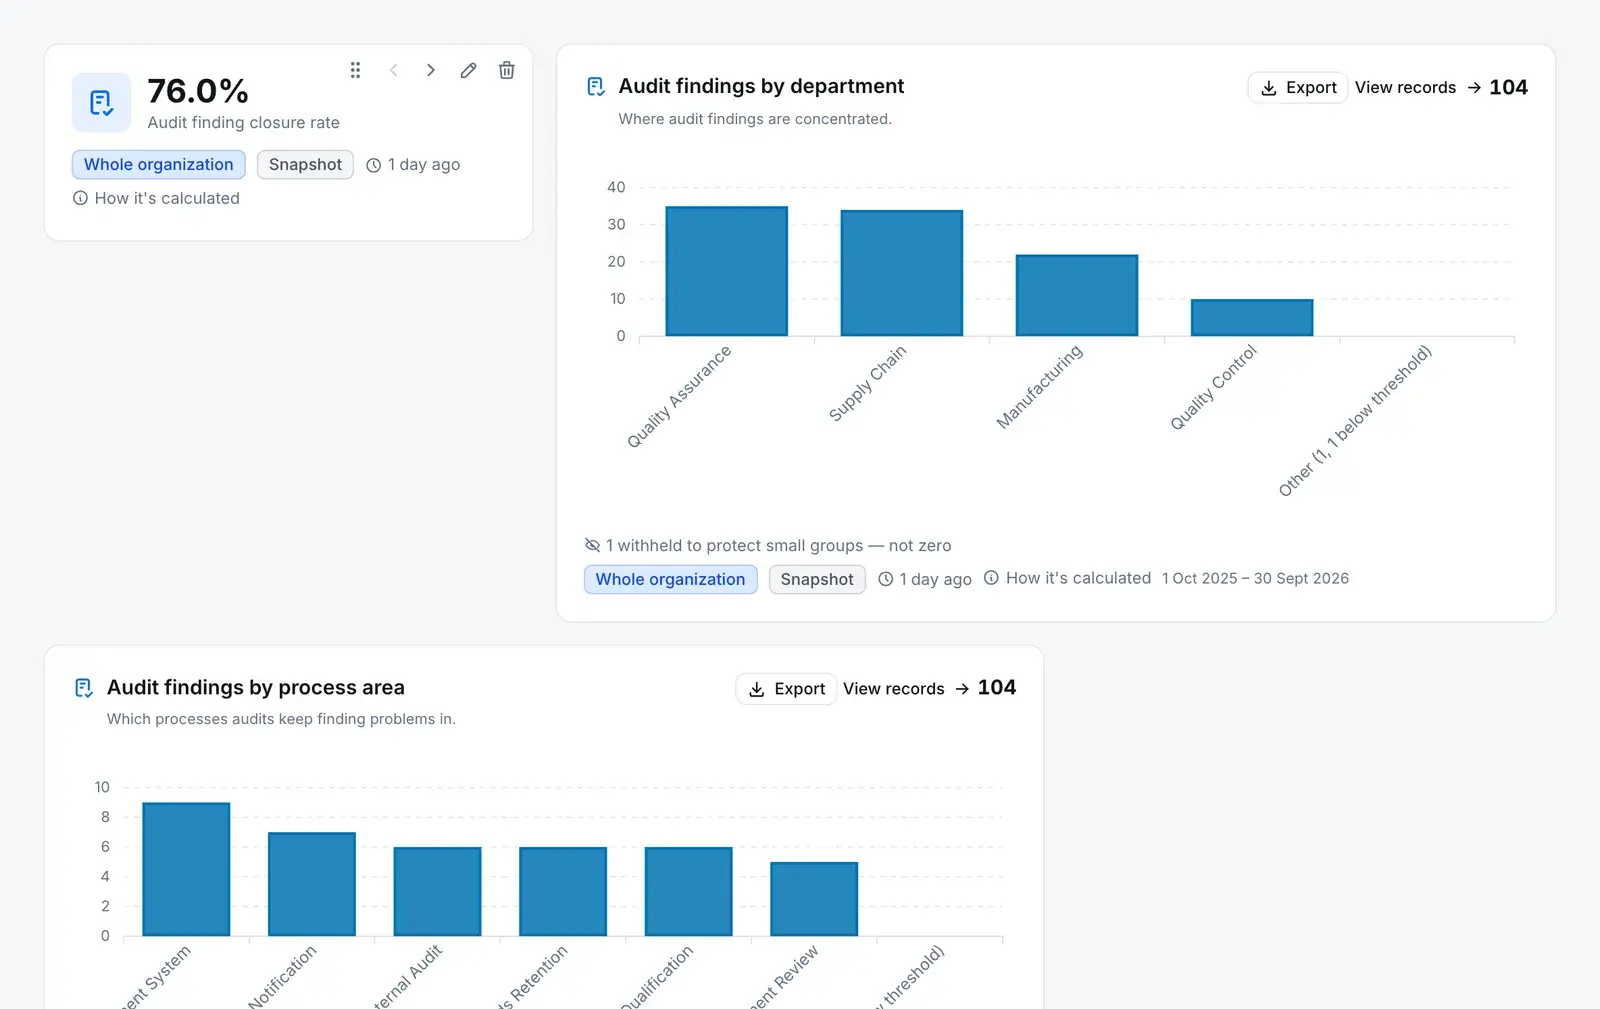
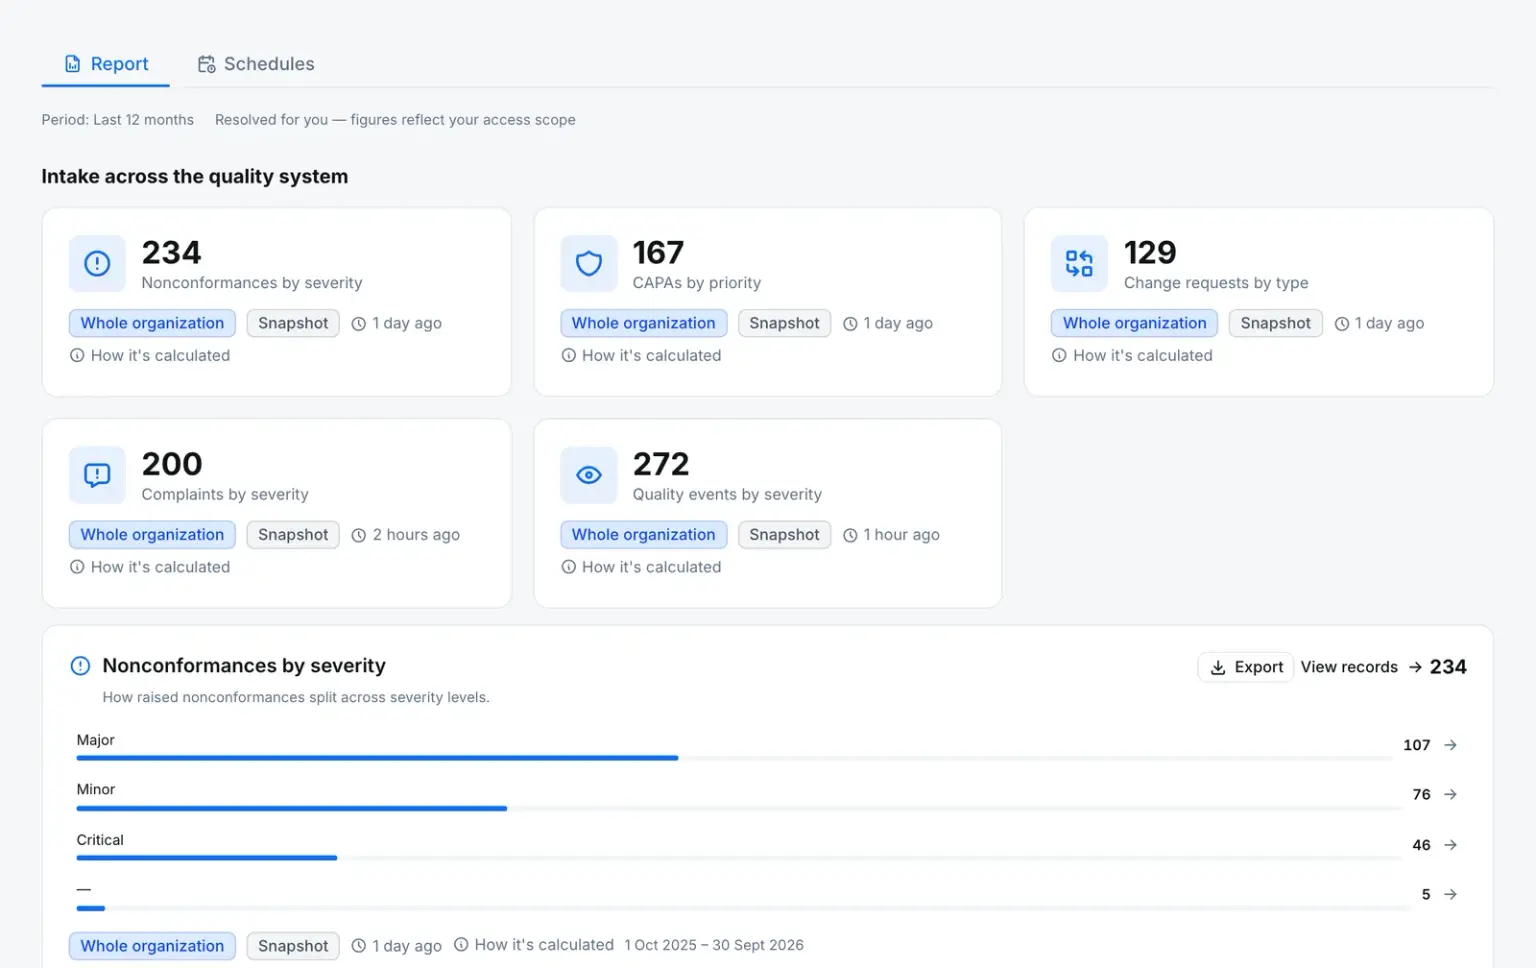
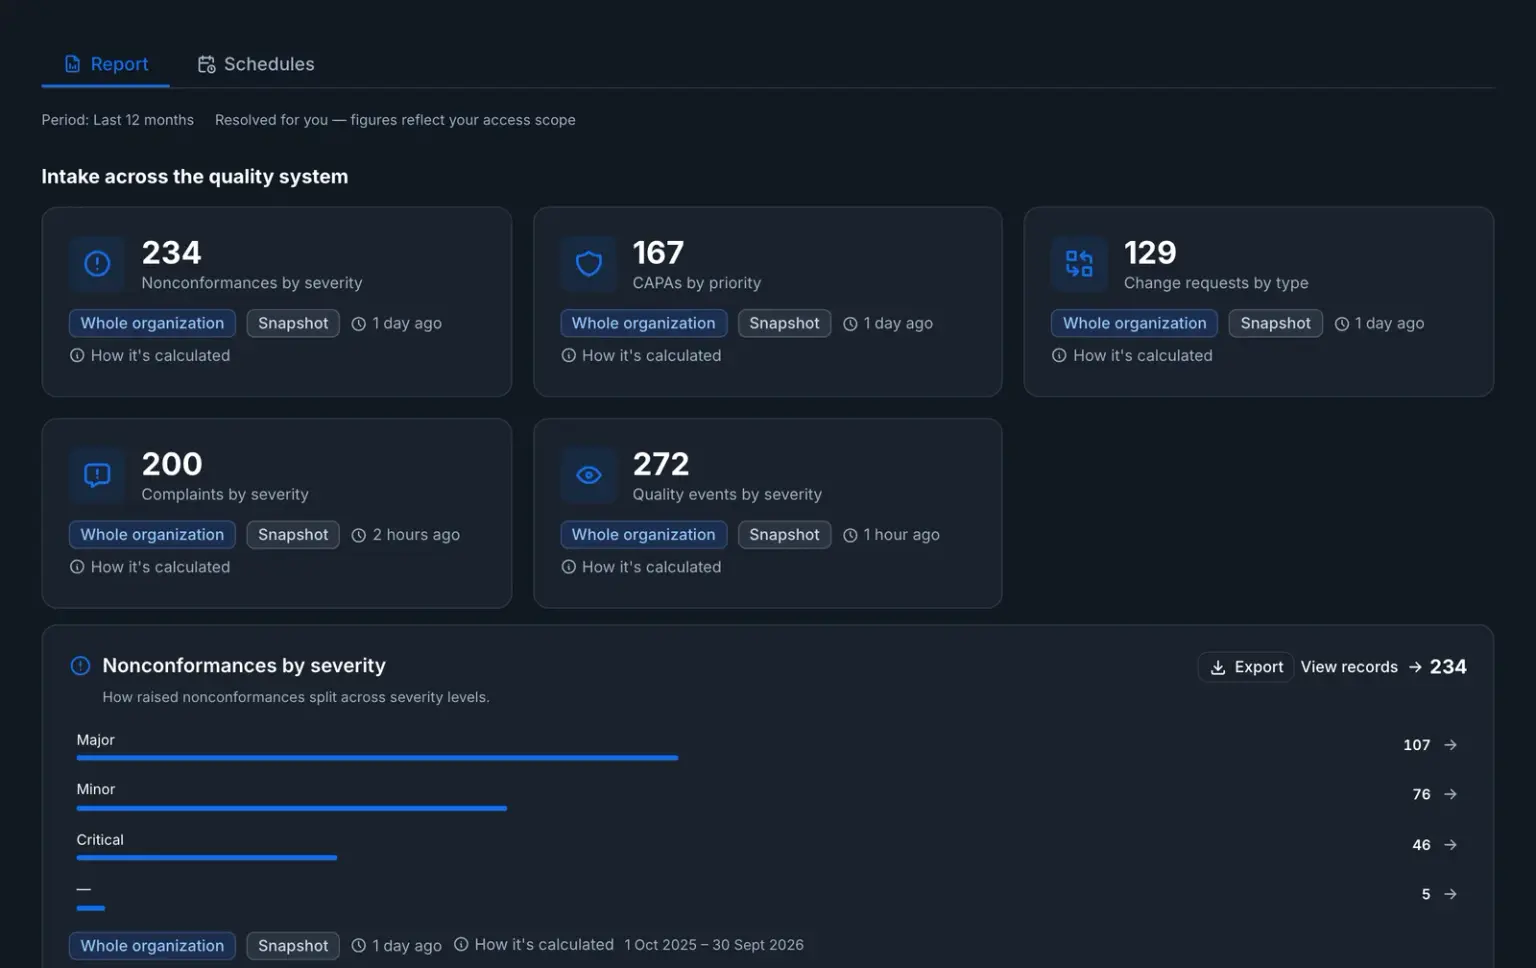
Every tile says whose numbers they are, and how old
A chart on a quality dashboard is evidence someone will act on. So each one carries its scope, its age and its definition, and it never passes off a hidden group as zero.
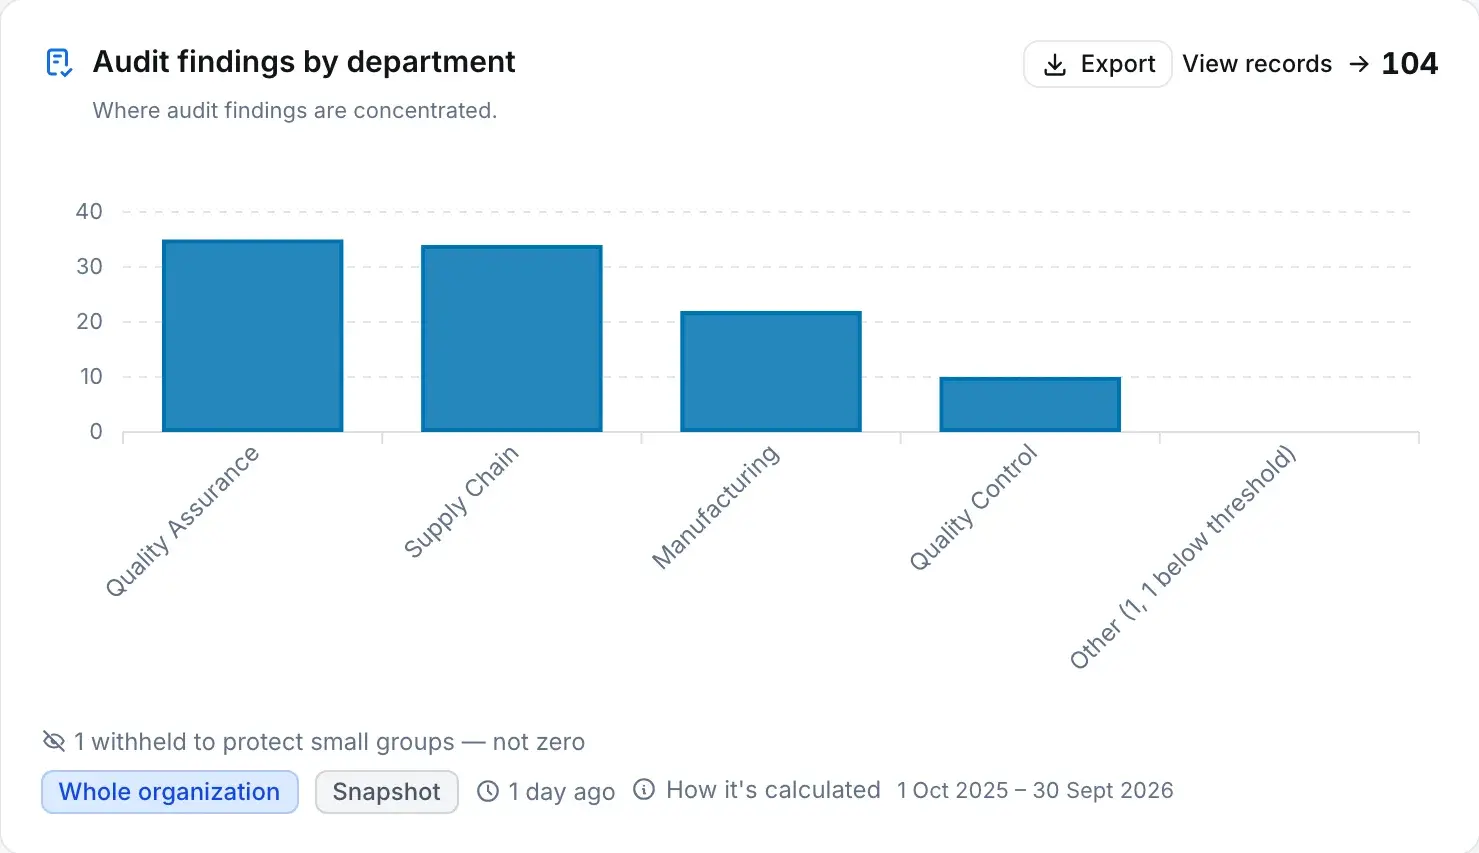
Withheld, not zero
A group of fewer than five records is withheld from a breakdown, and the tile says so, so a small team’s figure can’t be read off a chart.
Whose, when and how
The access it was computed under (the reader’s own), when it was computed, and how it is calculated. Analytics refreshes on a schedule; it is not live.
Dashboards
Boards built from tiles, kept private or shared with the company.
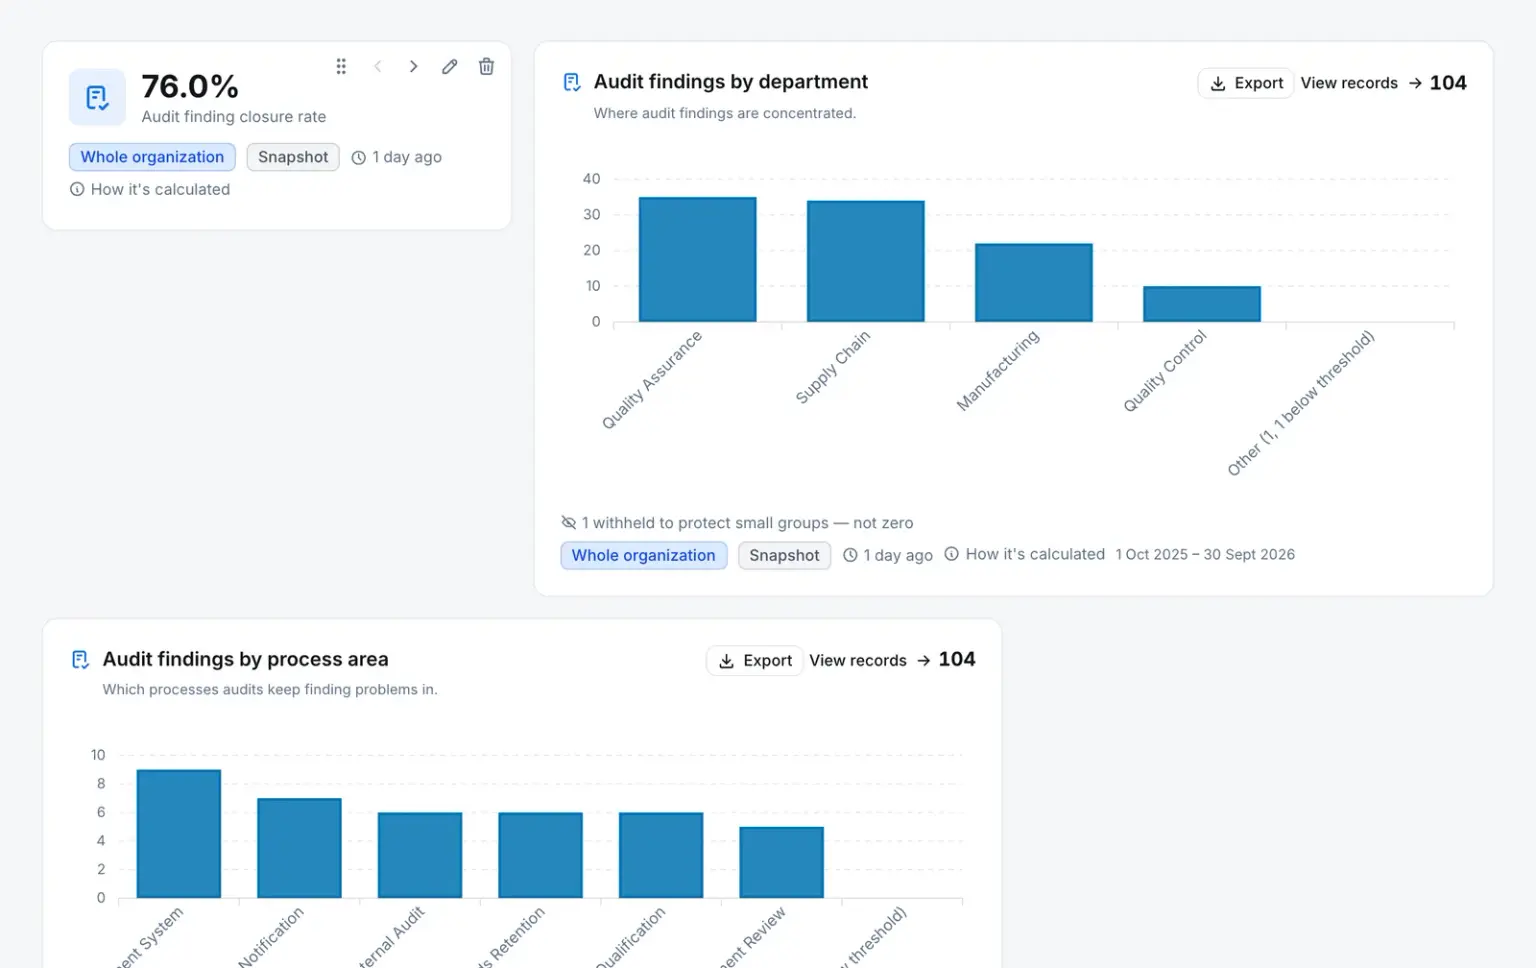
A tile is one metric drawn one way: a single number, a trend line, bars, a donut or a ranked list. Each tile sets its own period, from the last 30 days to the last 24 months, and a single-number tile can compare itself with the previous period or the same period last year. Share a board with the company and every colleague who opens it sees it resolved to their own access.
- Drag tiles into order and set how wide each one is
- Break a figure down by site, department or owner
- Private, or shared with the whole company
Metrics
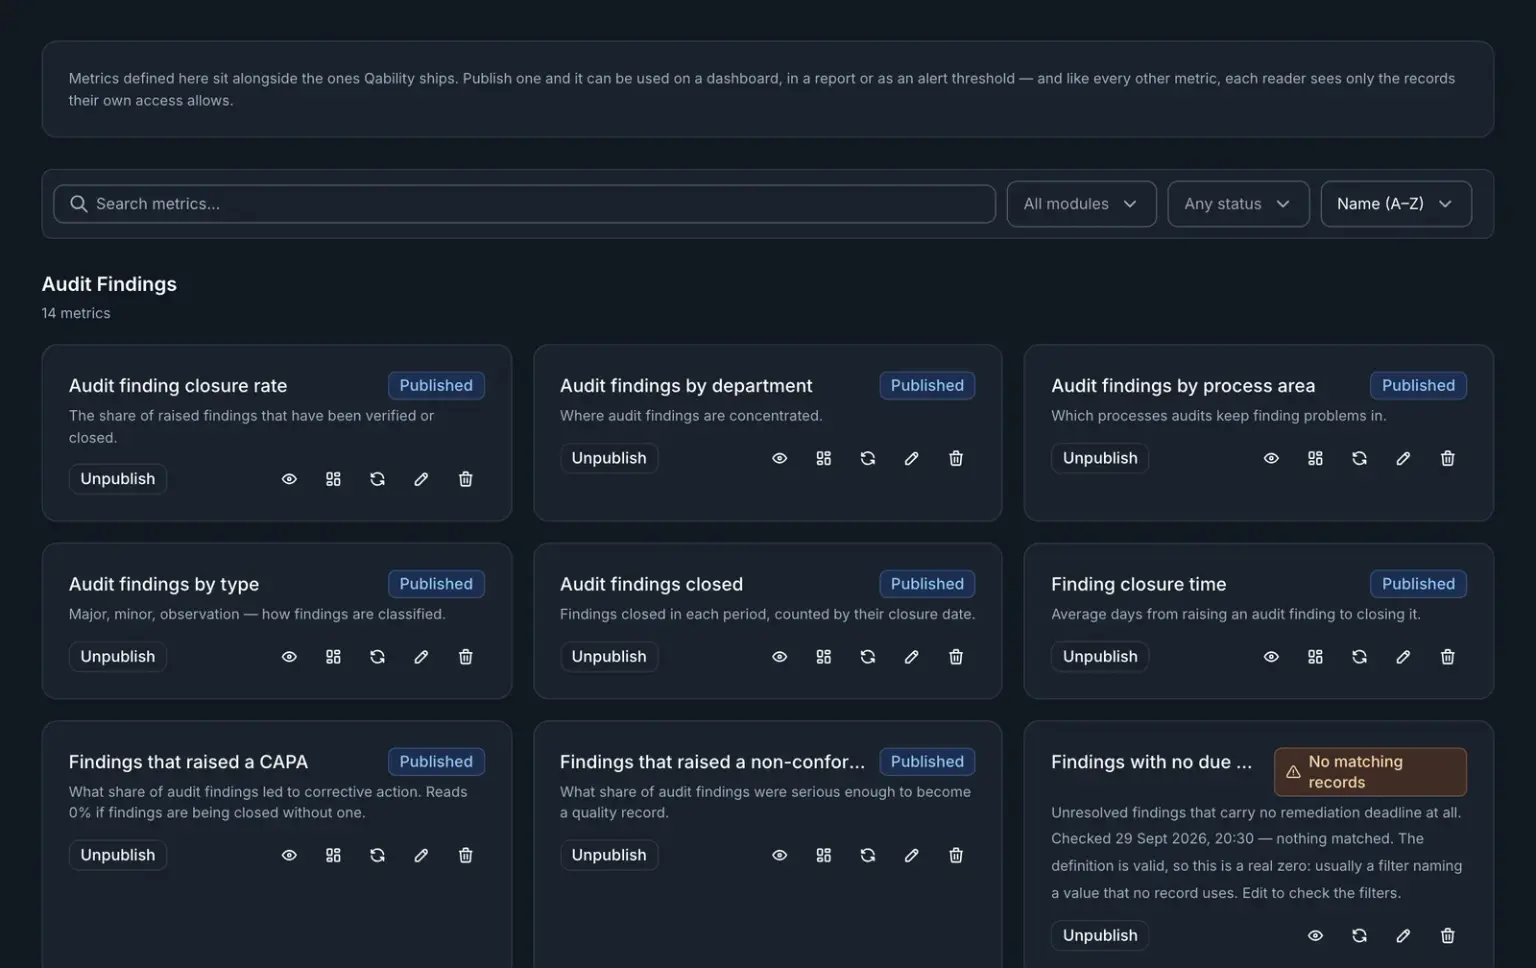
Define a metric without writing a query.
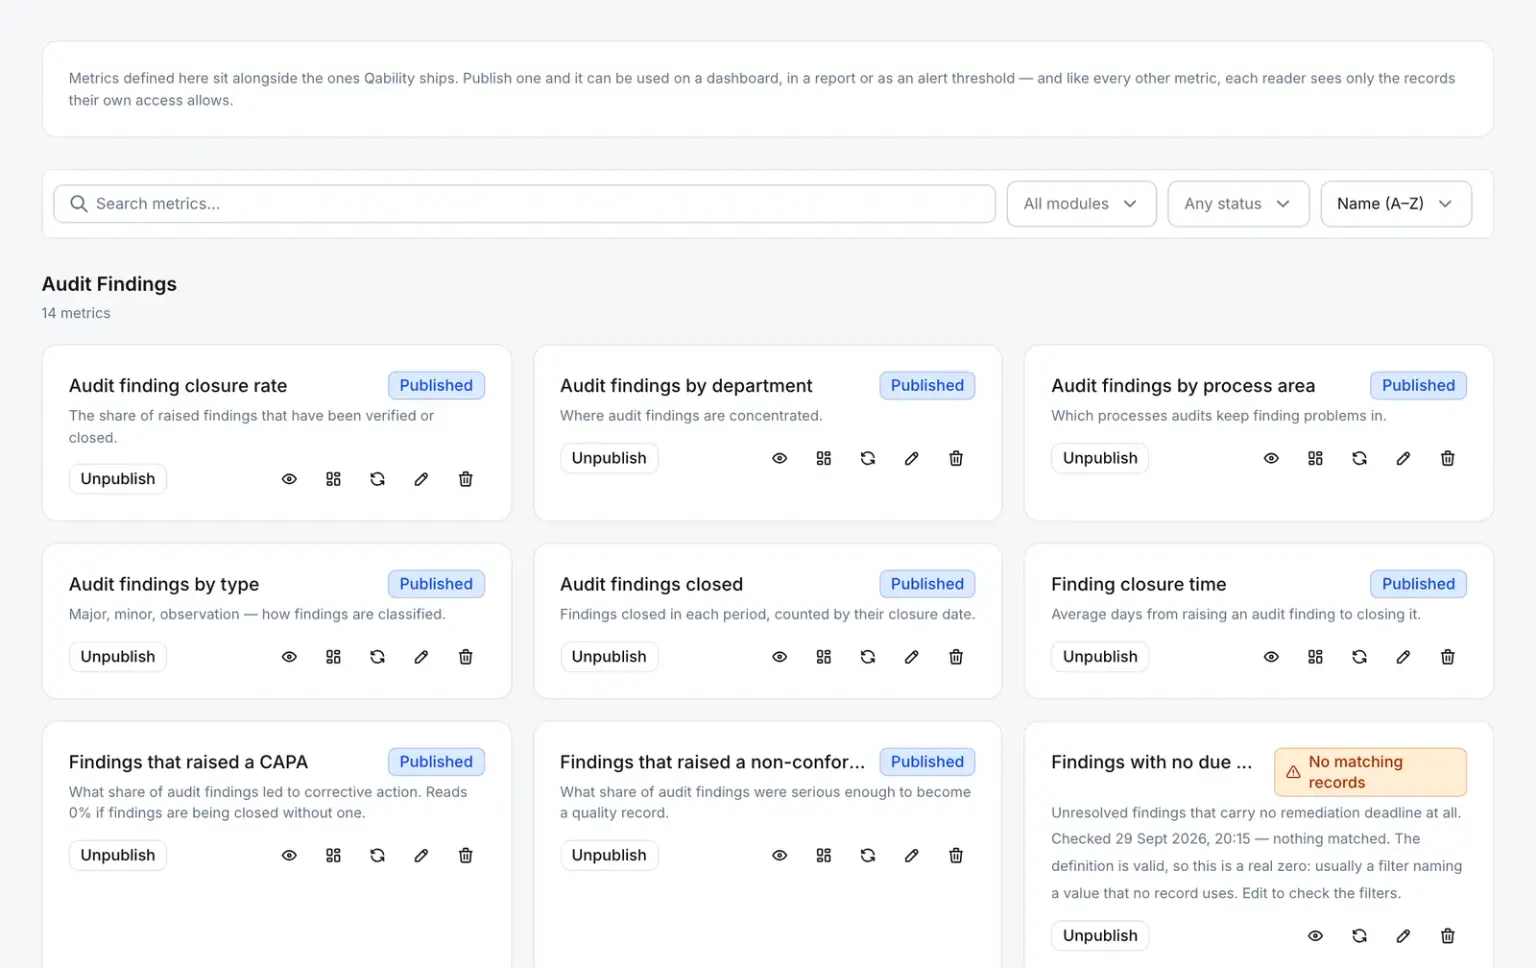
Pick a record type, choose what to measure and narrow it with filters. Publish it, and it can sit on a dashboard, in a report or behind an alert. Unpublish it without deleting it.
- Measure a count, a percentage, a sum or an average
- Filter on “is one of”, “is not one of”, “is set” and “is not set”
- A measure it can’t compute correctly is refused, not approximated
Reports and alerts
Reports on a schedule, alerts on a threshold.
A report gathers figures for a period into one document. Export it as PDF or Excel and it arrives by email; schedule it and it goes out on your timetable, in your time zone, to the people, teams or roles you choose. An alert watches one metric and notifies people when it crosses a threshold you set.
- Schedule recipients come from your company, never a typed-in address
- Up to ten threshold bands, each marked info, warning or critical
The rules, and who enforces them
What a figure won’t do
- A figure follows the reader’s access
- Every figure is computed under the reader’s own access, through the same row-level security that guards the records. A shared board never shows anyone a count drawn from records they could not open.
- Database refuses
- An average is an average
- An average is worked out from the sum and the count of the underlying records, never by adding up averages across periods or groups. A distinct count, which can’t be combined that way, is refused when the metric is compiled.
- Database refuses
- A schedule goes only to your people
- A scheduled report’s recipients are users, teams or roles in your company. There is no field for an email address, so a schedule can’t send figures outside it.
- Server refuses
- An export goes to the person who asked
- A PDF or Excel export of a report is emailed to the person who requested it, not offered as an open download link.
- Server refuses
Straight answers
What people ask before they trust a number
Is it real time?
No. Analytics is refreshed on a schedule, and every tile shows when its figures were computed, so nobody mistakes an older figure for a live one. The records themselves are always current; open the record list when you need this minute’s state.
Will two colleagues see the same number on a shared board?
Not necessarily, and that is deliberate. A board shares the questions, not the answers: each person sees the figures for the records their own access reaches. Someone with company-wide access and someone limited to one site can open the same board and see different numbers, both correct for them.
Why does a chart say a group was withheld?
Because it had fewer than five records. Showing it would let anyone work out a figure about a handful of people, so the tile leaves it out and says how many groups it withheld, rather than drawing a zero.
Can I send a report to someone outside the company?
No. Scheduled reports go to users, teams or roles in your company, and an export is emailed to the person who asked for it. If a customer or an auditor needs figures, someone inside exports the report and shares it the way you share any controlled document.
Does it use AI, forecasts or anomaly detection?
No. Every figure comes from a metric definition you can read under “How it’s calculated”. Nothing is predicted, and nothing is summarised in generated text.
Can I connect Power BI or Tableau?
Not today. There is no BI connector or analytics API. Reports export to PDF and Excel, which is where most teams start; tell us what you would connect and we will tell you honestly whether it is planned.
Can I filter a whole dashboard by site or department?
Not with one control. Each tile has its own period and can be broken down by site, department or owner, and each reader’s own access already limits what they see. A board-wide site or department filter is not there yet.